
On Tuesday, November 11, CECE held the final colloquium of the fall semester, which focused on the role of data visualization in climate communication. Our guest speaker, Megan, Senior Visual Content Producer at Climate Central, shared valuable insights from her work translating complex climate data into clear, engaging, and trustworthy visuals.
The discussion emphasized the importance of knowing your audience, keeping messages simple and focused, and making them matter by connecting global climate narratives to local experiences. Megan highlighted how design choices such as color, layout, and clarity influence interpretation, and how visuals can help bridge gaps in scientific literacy, disciplinary language, and cognitive understanding.
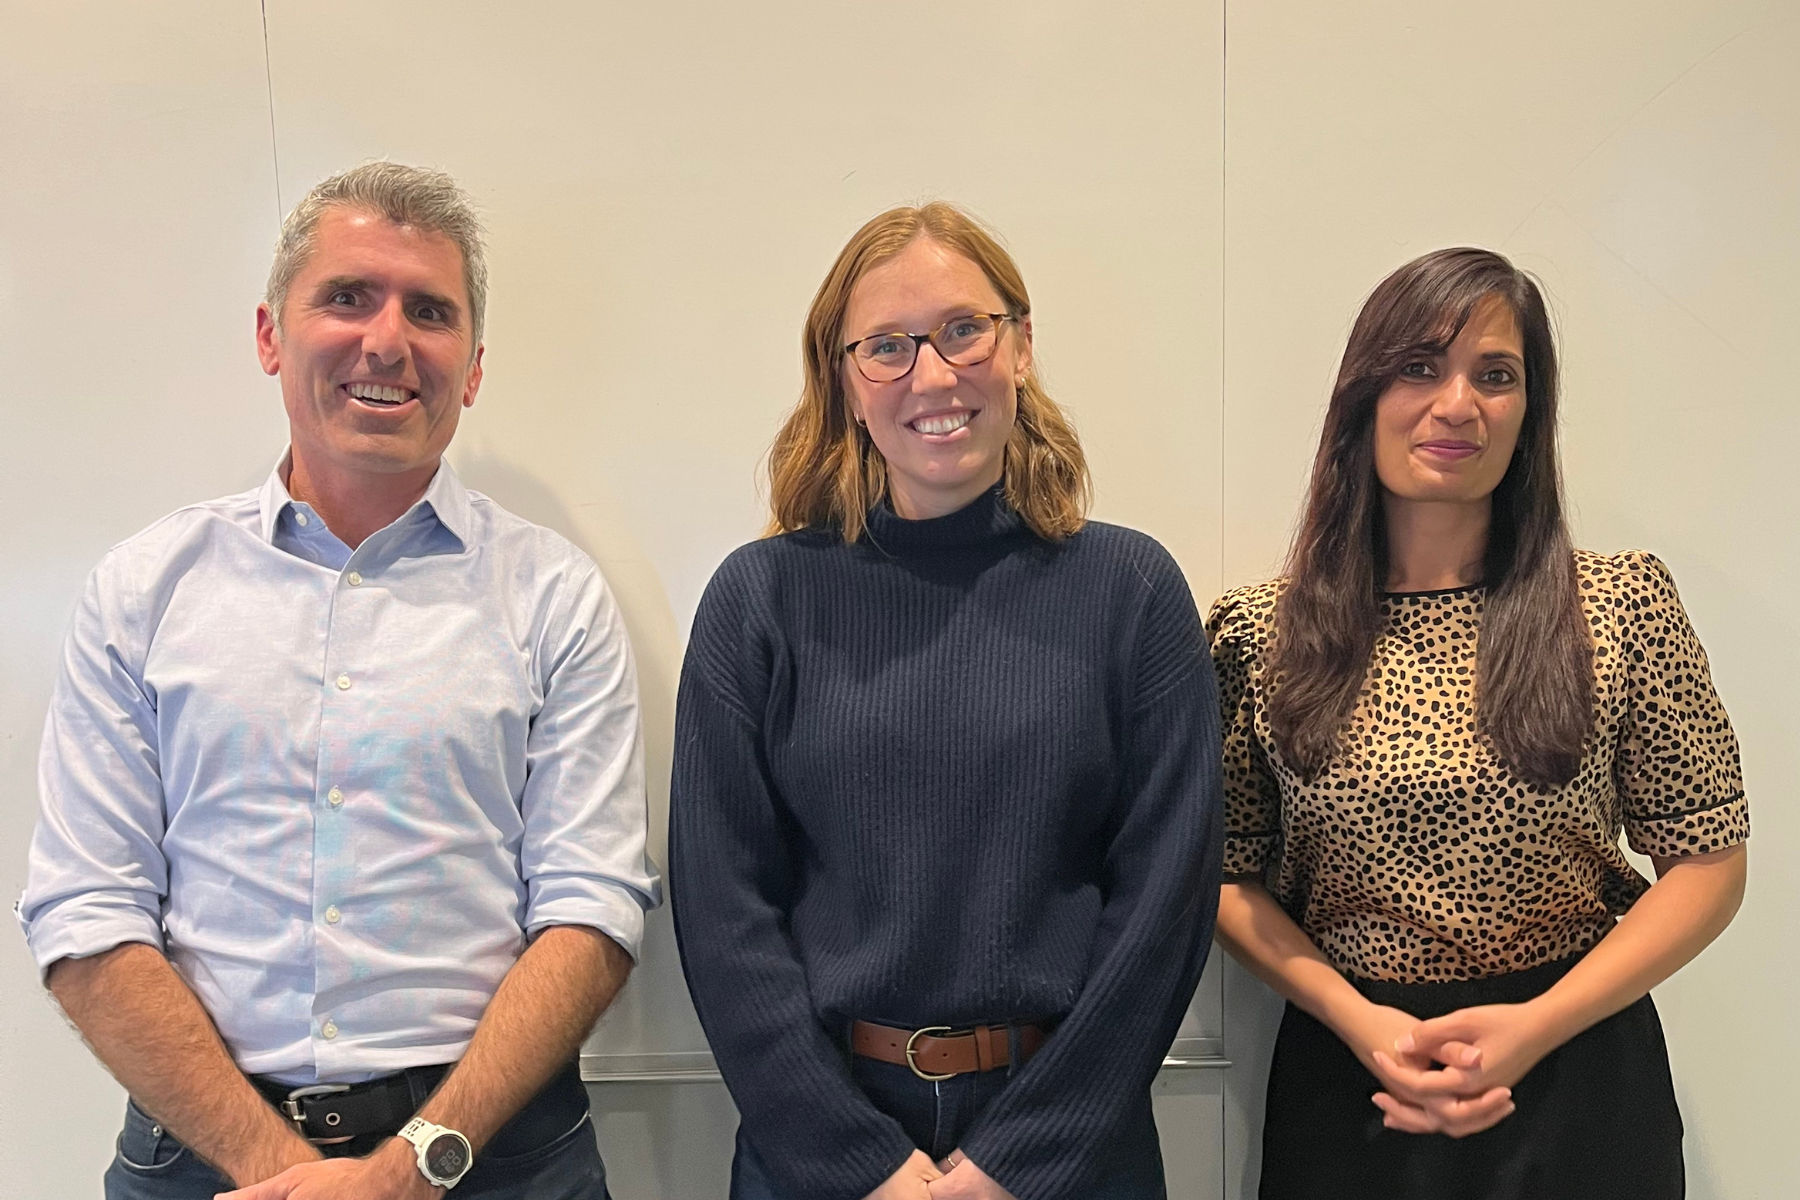
Following Megan’s presentation, Professors Mike Alonzo and Garima Sharma led the group in a discussion about how they use different methods of visualization in their research. One common theme was meeting people where they are at and using visuals to communicate messages when struggling with language. Afterwards, participants also explored strategies for communicating uncertainty and discussed the balance between accessibility and scientific defensibility.
The session concluded with reflections on the evolving role of AI in visual communication. While AI offers useful tools for supporting data interpretation, its use in generating images can raise questions of credibility and trust. Overall, the conversation underscored visualization as a powerful tool for storytelling, interdisciplinary collaboration, and public engagement with climate science.
